-Changes in Korean Travel Consumers’ Behavior and COVID-19; 2023-2024-
○ Since the declaration of the coronavirus pandemic in January 2020, the global travel and tourism market has plunged into a deep freeze. While domestic travel experienced varying degrees of recovery depending on each country`s policies, overseas travel entered a period of significant recovery only after the declaration of the pandemic in May 2023.
○ The pandemic has had a significant impact on travel-related statistics. While industry statistics for travel and tourism have been continuously compiled and published, consumer survey statistics have not. This is mainly due to the near impossibility of conducting consumer statistics reliant on face-to-face surveys during the pandemic period.
○ Since 2015, ConsumerInsight has been conducting a “Weekly Travel Behavior and Planning Survey", targeting 500 individuals per week (26,000 annually). This survey has been carried out in a non-face-to-face (online) manner, allowing for seamless continuation even during the pandemic period. This data is sufficient to fill the void left by face-to-face consumer survey data, which has become nearly impossible due to COVID-19 for at least two years.
○ ConsumerInsight has been introducing its proprietary "Travel Corona Index (TCI)" to vividly illustrate changes in consumer behavior before and after the COVID-19 pandemic. TCI is essentially calculated as `2023 results / 2019 results × 100`, indicating to what extent consumer behavior in 2023 changed compared to pre-pandemic 2019. In other words, TCI reflects the relative change in proportions rather than absolute changes in result values (such as ratios or averages). Examining TCI allows for a better understanding of the changes during and after the pandemic period.
○ The summary of the survey results utilized ConsumerInsight`s proprietary model T.R.A.V.E.L for analyzing travel consumer behavior as follows.
Ⅰ. Summary of comprehensive situation before, during, and after COVID
○ Overview of travel behavior
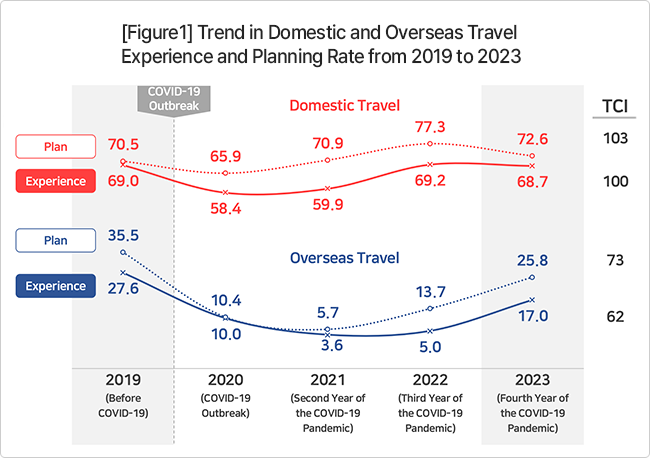
The COVID-19 pandemic has had a significant impact on both domestic and overseas travel, but the impact on overseas travel has been much greater. In the fourth year of the pandemic (2023), domestic travel experienced a recovery period after peaking in 2022, followed by a decline. However, overseas travel remained at only 62-73% of pre-pandemic levels despite the explosive increase in 2023. It appears that a longer period of time will be needed for a full recovery to pre-pandemic levels. However, domestic and overseas travel are intricately interconnected. The surge in overseas travel from 2022 to 2023 has led to a decline in domestic travel, and there is a significant possibility that it will continue to have a greater impact in the future.
○ Domestic travel
Domestic travel has recovered to pre-pandemic levels, having largely overcome the impact of COVID-19. The travel planning rate surpassed pre-pandemic levels in 2021, the second year of COVID-19, and reached a peak, setting a new record in 2022. Although it somewhat declined in 2023, it remains higher than the pre-pandemic level (TCI 103). The travel experience rate reached the level of 2019 in 2022, the third year of the pandemic, maintaining a TCI level of 100. With the increase in overseas travel, there is a possibility of a decline in domestic travel.
○ Overseas travel
After the WHO declared the pandemic, international travel plummeted rapidly, reaching a level of complete lockdown in the second year (experience rate in 2021: 3.6%, TCI 13). Since 2022, the planning rate has doubled, and the experience rate has more than tripled, experiencing an explosive surge in international travel. However, the TCI remains significantly below pre-pandemic levels, with experience at 62 and planning at 73. While the upward trend is expected to continue, a return to normalcy seems to require time.
Ⅱ. T.R.A.V.E.L Analysis
○ 2023-24 T.R.A.V.E.L Summary
Key transitional changes indentified for the domestic and international travel markets through the proprietary travel market analysis tool, T.R.A.V.E.L, are as follows:
1. Target(Travelers)
▣ Domestic
· Transition from the 30s&40s male market to the 30s&40s female market
· Travel is becoming feminized
▣ Overseas
· Males in their 20s are predominant and 20s&30s females declining
· More couples, fewer solo trips
■ Domestic Travel
- The core market is shifting from 30s & 40s males to females in the same age group. 30s & 40s females have travel experiences and plans with TCI (Travel Consumer Index) scores exceeding 105, indicating they are likely to hold significant sway in the market for the foreseeable future.
- Family travel is on the rise (TCI 104), with females in their 30s and 40s leading the trend, contributing to the feminization of travel. They are cost-conscious (TCI 152), seek and follow recommendations from acquaintances (TCI 150), and prioritize activities like meeting relatives (TCI 107) over consumption-oriented activities such as sightseeing, dining, and entertainment (TCI 72, 73, 87).
- Travel is becoming increasingly feminized.
■ Overseas Travel
- The major consumer has shifted completely from females in their 20s and 30s to males in their 20s, as observed in the pre- and post-COVID travel trends and forecasts. While the overseas travel experience rate among females in their 20s and 30s is at an average level (TCI 62, 65), males in their 20s have the highest TCI score at 77. Their intent rate, at TCI 81, is also recovering to pre-COVID levels at the fastest pace.
- The rapid rise of 20s male demographic is related to significant changes in post-COVID lifestyle. They have seen an increase in job opportunities, economic stability, and an improvement in their quality of life. Furthermore, there has been changes in leisure activities related to alcohol-centered socializing. The increased social conflicts centered around gender and the generation gap have led men in their 20s to travel abroad, expecting a warm welcome from exotic cultures where Korean culture is widely accepted.
- Solo travel is declining while travel with opposite sex partners is increasing. With group and companion travel becoming challenging due to COVID, solo travel saw a sharp increase in relative importance, from TCI 275 in 2021 to TCI 182 in 2022, before significantly decreasing to TCI 83 in 2023. In contrast, travel with partners saw a significant increase to TCI 140. This could be attributed to delayed milestone trips due to COVID.

2. Resource
▣ Domestic
· Financial resources significantly reduced due to the economic downturn and inflation
· Travel focused on people (friends and acquaintances) rather than consumption
▣ 해외
· Interest in travel content declined, while cost sensitivity rose
· Reduced activities and more focus on food
■ Domestic Travel
- The proportion of people considering expenses as the primary factor when selecting travel destinations has significantly increased (TCI 152). In addition, travel plans also aim to reduce consumer spending on attractions, food, and entertainment (TCI 88-94).
- Hobbies such as fishing, water sports, and winter sports, which incur costs, are being reduced (TCI 72, 88, 81), while hiking is planned to increase (TCI 110). Golf, which is predominantly enjoyed by the high-income bracket, is expected to see an increase both domestically and internationally, with the exception (TCI 115, 125).
- There`s a shift from consumption-focused travel to people(friend)-oriented travel.
- Not only has reliance on recommendations from acquaintances for selecting travel destinations increased significantly (TCI 150), but also the importance of their recommendations for food/restaurants (TCI 110) and meeting plans (TCI 128) is high. Word of mouth serve as reliable sources of information filling the gap left by weakened public and commercial sources, while also offering possibilities for cost reduction and risk avoidance. Additionally, they contribute to the restoration of relationships that were strained by the pandemic.
- The increase in people-oriented travel may result in a decrease in travel spending, which could potentially lead to the contraction of the travel industry.
■ Overseas Travel
- Travel conditions have become even more important than the content of travel. The focus has shifted from what to do to how to go about it, indicating that the manner of travel is now of greater importance.
- The desire to save costs is greater in overseas travel compared to domestic travel. The tendency to seek appropriate travel expenses as a reason for selecting overseas travel destinations has more than doubled compared to pre-pandemic levels. In 2019, the response indicating ‘cost’ as important in choosing a travel destination (7.8%) ranked fifth, following attractions, itinerary, prices, and proximity. However, in 2023, ‘cost’ rose to second place with 15.7% (TCI 201). This indicates a significant sensitivity to costs in overseas travel.
- ‘To See·To Have Fun·To Eat’ are the core contents of travel. However, interest in these aspects has significantly decreased (TCI 66, 89, 82). People are increasingly neglecting the essence of travel and focusing solely on costs. There`s a rise in ‘aimless’ travel, where people simply depart without a clear purpose, solely based on cost considerations.
- One noteworthy aspect is the emergence of culinary experiences as one of the primary purposes of overseas travel planning (TCI 118).
- It is important to note the decreasing culinary interest domestically (TCI 88) contrasts with its significance as a leading resource for guiding Korean travelers abroad. Behind the overseas travel trend, there may be a possibility of culinary experiences not fulfilled domestically, driving travelers to seek them internationally.
3. Accessibility
▣ 국내
· Nearby areas like Seoul and Gyeonggi preferred for cost reasons
· Psychological accessibility more important than physical
▣ 해외
· Choosing Japan and Southeast Asia for budget / proximity
· Japan`s appeal lies in affordable food, shopping, and small pleasures
■ Domestic Travel
- The strong inclination towards low-cost and nearby destinations makes it increasingly challenging to attract long-distance customers.
- Interest, market share, and planning rates for travel destinations in the metropolitan area, Gangwon, and Chungcheong regions have all increased. Particularly notable is the significant increase in travel planning focused on Seoul and Gyeonggi Province (TCI 112, 117).
- On the other hand, the allure of Jeju Island and Busan, which are far from Seoul metropolitan area, is diminishing. The travel experience rates for Jeju and Busan are relatively low, with TCI scores of 88 and 78, respectively, and the planning rates are 79 and 81, respectively. Both the number of visitors and the intention to visit are decreasing, making the future uncertain.
- The common advantage of Jeju and Busan is their possession of abundant travel and tourism resources at the highest level domestically. However, their shared disadvantages include their geographical distance from the metropolitan area and the fact that their travel environments rank among the lowest. If the poor travel environment (e.g., high prices, lack of amenities, overcharging) is perceived by potential travelers, then psychological accessibility is likely to be significantly reduced.

■ Overseas Travel
- Overseas travel is recovering rapidly, but like domestic travel, it is inevitably influenced by the principles of nearby and low-cost destinations. Particularly, travel experience rates are rapidly rising in Asian regions such as Japan (TCI 133), Vietnam (TCI 127), and Thailand (TCI 111).
- Japan`s accessibility is undoubtedly outstanding. Not only is it the closest in terms of geography and time, but it`s also cost-effective due to the yen`s low value. Moreover, it offers familiar and highly satisfying culinary experiences, along with opportunities for enjoyable small-scale shopping. It is perceived as the optimal destination for experiencing small joys and contentment.
- Jeju Island`s main competitor is indeed Japan. There`s hardly any other country that matches Japan in terms of geography, cost, and environment. In fact, based on a 3-night 4-day trip, the travel expenses for Japan are twice as much as Jeju Island`s. When people say "For that price, you might as well go overseas," it reflects the psychological accessibility, implying that Japan offers a better experience, even if it means being willing to pay twice as much.
4. Value for money(Cost)
▣ Domestic
· Extremely cost-conscious, prioritize food when choosing destinations
· Culinary experience significantly drops when choosing destination and activities
▣ Overseas
· Prioritizing satisfaction for cost over actual cost or cost-effectiveness
· Despite higher costs (7.7 times more), preference remains for overseas travel
■ Domestic Travel
- The largest portion of travel expenses is attributed to food and beverages, accounting for 34.7% in 2023. Comparing to 2019, the rate of increase in food and beverage costs (TCI 115) surpasses the overall increase in travel expenses (TCI 112). However, considering that the actual increase in food prices is much higher, it suggests that consumers have made significant efforts to mitigate these costs.
- Among all expenditures, food is the item where consumers can assess "value for money" most effectively. The fact that ‘food’ as a reason for choosing a travel destination experienced the largest decrease (TCI 73), and it was also the weakest aspect in travel planning (TCI 88), indicates dissatisfaction with food.
- Cost-effectiveness refers to whether a product or service`s value justifies its cost. On the other hand, Satisfaction for Cost indicates whether both the product/service and the seller meet consumer expectations. The issue lies in the fact that the Satisfaction for Cost is consumer-centric. Considering that evaluations of a destination`s cost and convenience come from the food mostly, emphasizing the importance of food is not excessive.
■ Overseas Travel
- In 2023, the average cost of overseas travel was 1.834 million won (TCI 130), with a cost per night of 299,000 won (TCI 112). Despite the cost increasing from 6.7 times to 7.7 times compared to domestic travel before COVID-19, the demand for overseas travel remains higher. Indeed, it is surprising, especially considering the significant increase in responses citing ‘because the cost is reasonable’ as the reason for choosing a travel destination.
- The purpose and content of overseas travel are not particularly important. The primary focus is on fulfilling pent-up desires. It`s essential to embark on the journey as soon as feasible within one`s financial means.
- Despite this, satisfaction for cost of overseas travel is higher than that of domestic travel. In 2023, the satisfaction rate for overseas travel was an average of 3.92 out of 5.0 points, significantly higher than the domestic average of 3.80. While both domestic and overseas TCIs are lower than in 2019 (97 and 99 respectively), satisfaction with overseas travel is higher.
- The meaning of "For that price, you might as well go overseas" implies that choosing overseas travel is not necessarily because it`s better than domestic travel, but rather because it`s perceived as less disappointing than domestic travel. Overseas travel, chosen for its relatively cheaper (though significantly higher) experience without a clear purpose, has a better satisfaction for cost than domestic travel, which incurs much lower costs while offering a more fulfilling travel experience.

5. E-connect(Internet connectivity)
▣ 국내
· Public institutions` online platforms overlooked for travel information
· Specialized travel commodity websites and apps gaining traction, expanding their scope
▣ Overseas
· ommodity owners` influence persists, sellers face pressure
· Mobile device usage surges for purchases and reservations, while PC usage declines sharply
■ Domestic Travel
- There is a growing tendency to rely on recommendations from friends and social media when choosing travel destinations or purchasing travel products or commodity, rather than relying on public or commercial channels.
- When selecting travel destinations, there`s an active exploration of information through recommendations from friends. These recommendations are highly utilized for exploring information about destinations, transportation options, and accommodations. They rank second after blogs for information on meals, activities, and tourist attractions. There`s also a significant acquisition of information through social media channels, which focus on communication and empathy. Particularly, there`s a tendency to seek out vivid personal experiences from specific individuals when choosing a travel destination.
- On the other hand, the utilization of official destination websites and travel-specific sites/apps for choosing travel destinations is low. This is because official destination websites often provide information in a rigid format with limited content, and sometimes outdated content. People feel that personally hearing about experiences and evaluations from friends or individual consumers is more useful.
■ Overseas Travel
- Travel-specialized websites/apps are significantly lagging behind in terms of product/commodity offerings, except for accommodations (with a market share of 70%). While package sales have seen a sharp increase (TCI 181), they still rank second. On the other hand, channels such as comprehensive travel agencies, social commerce, and online marketplaces are on the decline. Overseas travel relies less on recommendations from friends due to relative difficulty, with blogs playing a primary role instead.
- Since the outbreak of COVID-19 in 2020, mobile has gained prominence as the primary device for booking and purchasing overseas travel products. In 2023, mobile has surpassed Personal Computer by a ratio of 2:1, and this difference is expected to widen further.
6. Loyalty(Satisfaction/Re-visit/Recommend)
▣ Domestic
· Satisfaction and intent to revisit domestic travel destinations stagnant or declining
· Jeju Island shows the most significant decline across all aspects
▣ Overseas
· Europe and Japan top satisfaction rankings
· Japan, with high ‘satisfaction for cost’ and strong competitiveness, emerges as a Jeju alternative
■ Domestic Travel
- The perceived satisfaction, willingness to recommend, and intention to revisit for domestic travel have all decreased compared to before the COVID-19 pandemic (TCI 97, 98, 99 respectively). This indicates a decline not only in satisfaction but also in the inclination to recommend and revisit.
- Particularly noteworthy is Jeju Island. Jeju Island experienced the most significant decline in satisfaction, willingness to recommend, and intention to revisit, all with a TCI of 96, making it the top among the 16 regions for declines in all areas. Its rankings also dropped to 6th, 5th, and 4th place, respectively. These objective figures serve as evidence of the recent controversies surrounding Jeju Island.
- These results are evidenced by the travel intention rate. The intention rate, which was 16.9% in 2019, fell to 13.3% in 2023, resulting in a TCI of 79, the lowest among all regions nationwide. This decline demonstrates the fall of Jeju Island, which previously showed the highest preference and loyalty among all travel destinations nationwide before the COVID-19 era (2017-18).

■ Overseas Travel
- While the perceived satisfaction with Overseas Travel is slightly lower compared to pre-COVID levels (TCI 99), the willingness to recommend and intention to revisit have both increased slightly (TCI 101 each). Among these, Japan stands out prominently.
- Japan has received the highest ratings compared to the previous period in terms of satisfaction, willingness to recommend, and intention to revisit (TCI 101, 107, 107 respectively). It can be considered the top performer in all categories, indicating the potential for continuous growth.
- Japan is a destination that aligns perfectly with the recent trends of Korean consumers, who are relatively seeking low-cost, nearby, and short-term travel options. With Japan offering affordable culinary delights?a key aspect of travel evaluation?and the added pleasure of experiencing the yen`s devaluation during shopping, coupled with warm hospitality, it`s no wonder that satisfaction levels are high. By understanding consumers` perception of Japan as feeling closer than Jeju Island, one can discern the reasons behind their avoidance of Jeju Island.
※ Reference
1.
(Overseas)2018-19 TRAVEL report 2019.03.27
2.
2020-2021 Travel Trends in Korea based on T·R·A·V·E·L Analysis 2021.03.09
3.
ConsumerInsight X Tidesquare predicts 2024 travel trends for outbound Korean travelers 2023.12.27
4.
2017-2023 Basic Analysis Report
| T. |
(III. Domestic Travel Behavior) |
1. Domestic Travel Experience Rate (p.15) |
7. Companion (p.18) |
|
|
9. Reason for Choosing Travel Destinations (p.19) |
10. Main Travel Activities (p.20) |
|
(IV. Domestic Travel Plan) |
1. Domestic Travel Plan Rate (p.39) |
|
|
(V. Overseas Travel Behavior) |
1. Overseas Travel Experience Rate (p.45) |
7. Companion (p.48) |
|
(VI. Overseas Travel Plan) |
1. Overseas Travel Plan Rate (p.63) |
|
| R. |
(III. Domestic Travel Behavior) |
9. Reasons for Choosing the Destinations (p.19) |
16. Criteria for Choosing Restaurants/Food (p.23) |
|
(IV. Domestic Travel Plan) |
8. The Main Purpose of Planned Travel (p.43) |
9. Hobby/Sports Activities During Travel Plan (p.43) |
|
(V. Overseas Travel Behavior) |
9. Reasons for Choosing the Destinations (p.49) |
|
|
(VI. Overseas Travel Plan) |
9. Main Travel Activity Plans (p.67) |
10. Hobby/Sports Activities During Travel Plan (p.68) |
| A. |
(III. Domestic Travel Behavior) |
3. Travel Duration (p.16) |
|
|
(IV. Domestic Travel Plan) |
3. Planned Travel Destination/Regions (p.40) |
|
|
(V. Overseas Travel Behavior) |
8. Travel Type (p.49) |
|
| V. |
(III. Domestic Travel Behavior) |
23. Total Travel Spending (p.31) |
24. Travel Expenses by Category (p.31) |
31. Travel Destination Satisfaction (p.35) |
|
(V. Overseas Travel Behavior) |
18. Total Travel Spending (p.58) |
19. Travel Destination Satisfaction (p.59) |
| E. |
(III. Domestic Travel Behavior) |
17. Information Search Channel (p.24) |
|
|
(V. Overseas Travel Behavior) |
15. Reserving/Purchasing Channel (p.54) |
16. Reserving/Purchasing Method (p.56) |
| L. |
(III. Domestic Travel Behavior) |
31. Travel Destination Satisfaction (p.35) |
32. Travel Destination Revisit Intent (p.36) |
33. Intent to Recommend Travel Destination (p.37) |
|
(V. Overseas Travel Behavior)) |
19. Travel Destination Satisfaction (p.59) |
20. Travel Destination Revisit Intent (p.60) |
21. Intent to Recommend Travel Destination (p.61) |
|
Consumer Trend Lab of ConsumerInsight conducts a weekly survey called the `Weekly Travel Behavior and Planning Survey`, targeting 500 travelers per week (26,000 annually). The survey results and analysis reports, updated weekly, can be viewed at https://www.consumerinsight.co.kr/leisure-travel Additionally, summarized data for each year`s survey results can be downloaded from the website.
|
Please contact the personnel in the below for detailed content of this press release